
Communities / Industries
Source recovered materials closer to demand.
A distributed facility network can supply nearby energy-intensive industries with locally recovered product streams, subject to technical qualification.
The problem
The Clean Carbon Energy response
Produce industrial materials closer to demand.
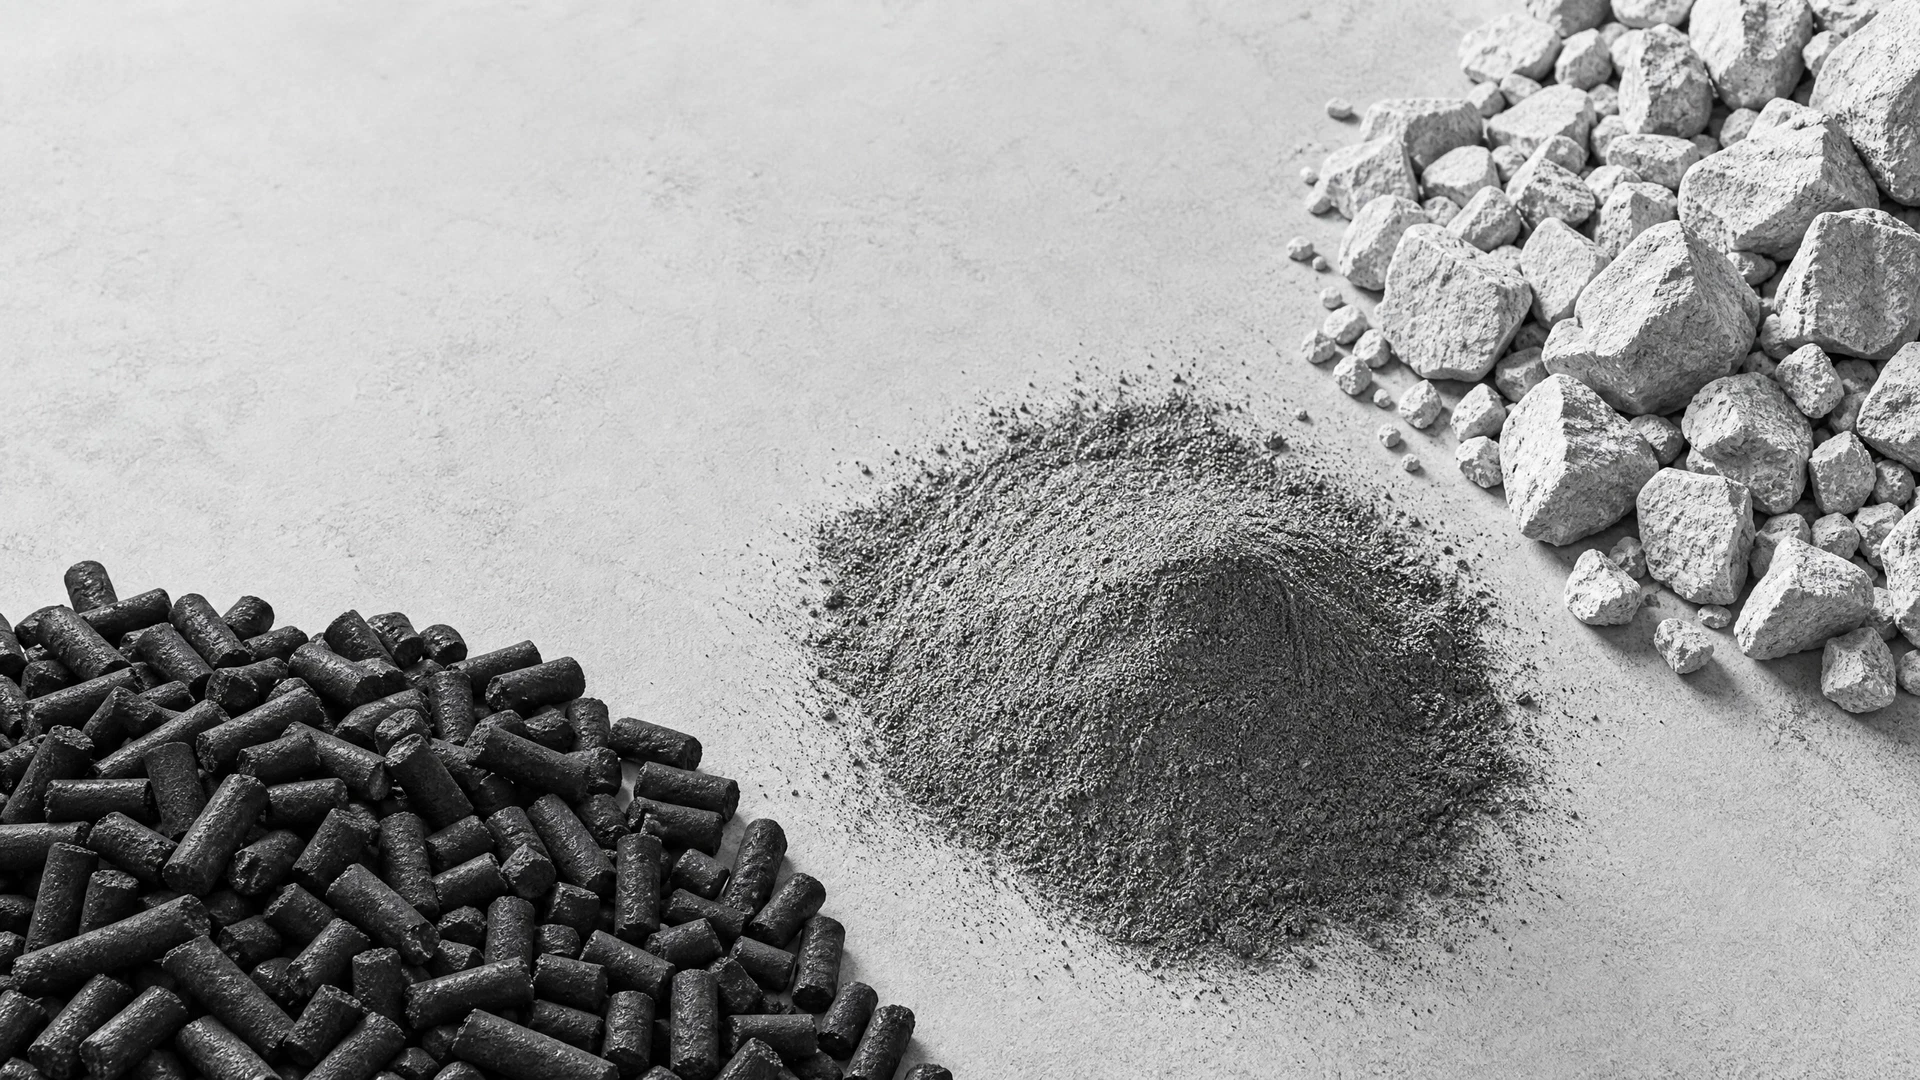
Clean Carbon Energy’s network links underutilised municipal material with local industrial demand through three product streams, subject to qualification.
Inputs
Your plant & current fuel
Plant
Current alternative fuel
Primary fuel
Reference default: Egyptian Customs Authority via Nafeza · 3 September 2026. All fields remain editable.
Carbon Border Adjustment Mechanism exposure (optional)
Advanced: fuel properties and feed system
Methodology
A defined scope without exposing the proprietary layer.
Kiln-efficiency penalties use the moisture and net-calorific-value gap coefficients in the Clean Carbon Energy model, with published coefficients cited to Duda and IEA CCC/71. Emission factors are 94.6 for coal, 97.5 for pet coke, and 91.5 tCO₂/TJ for the fossil fraction of alternative fuel, cited to IPCC 2006 and Directive 2007/589/EC. Results require plant-specific calibration.
Full assessment
Request a technical BioSRF comparison.
Clean Carbon Energy will use actual plant inputs to prepare a comparison covering landed cost, kiln efficiency, feed-system capacity, Carbon Border Adjustment Mechanism exposure, and pricing.